




Logistics Optimization in 2026: Strategies, Software & AI

 Updated on Oct 16, 2026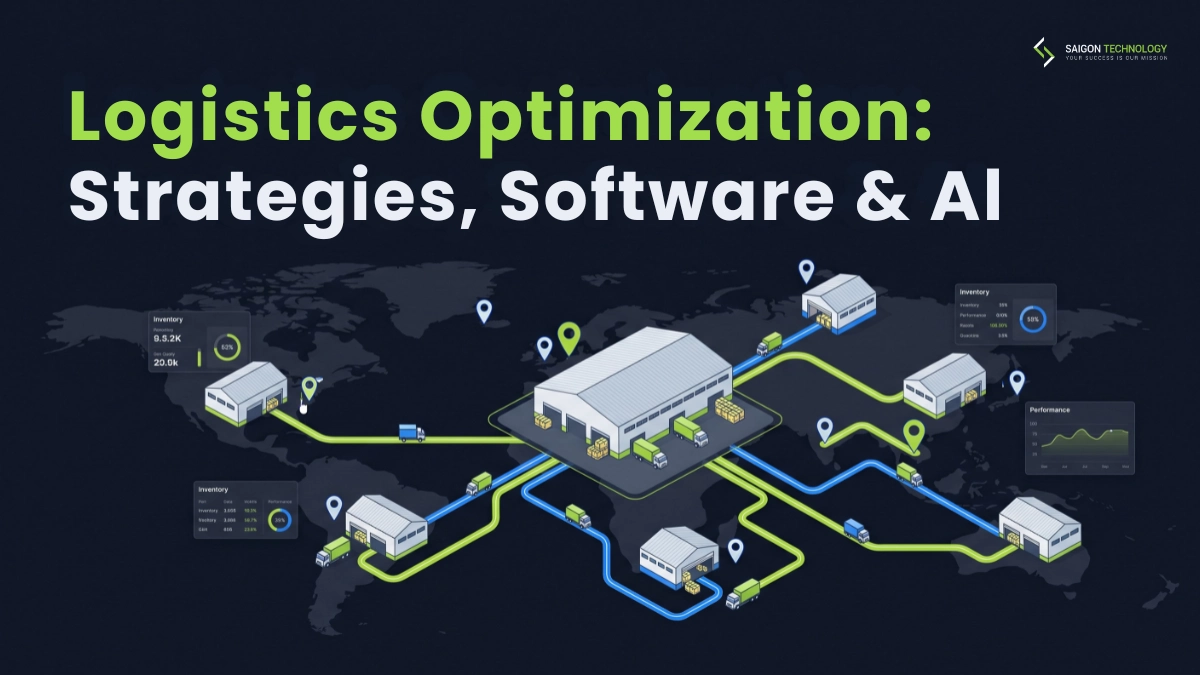
Fuel costs, driver shortages, and two-day delivery promises are squeezing logistics budgets in 2026. Spreadsheets and dispatcher judgment cannot keep pace with that many moving parts, and the gap shows up as empty miles, idle docks, and stock in the wrong place.
Logistics optimization is the practice of using data, analytical models, and software to lower the total cost of moving and storing goods while meeting service targets such as on-time in-full (OTIF) delivery. It works at two levels: daily tuning of routes, loads, and labor, and structural redesign of facilities, sourcing, and distribution flows. This guide covers the techniques, the model types behind them, the main software categories, and how to decide between buying a platform and building one.
Key Takeaways
- The largest gains come from planning network, routing, warehouse, and inventory decisions together rather than tuning each area on its own.
- Documented results are case-specific. A US EPA SmartWay case reports a grocery distributor cut its fleet by 38% and its annual travel by 400,000 miles after relocating a distribution center and adopting route planning (US EPA SmartWay, 2019).
- TMS, WMS, and dedicated optimization engines solve different problems, so choose by the decision you need to improve, not by feature count.
- Build vs. buy usually resolves at the integration layer, not the algorithm layer.
- Start with a bounded pilot on one region, lane, or product line, and measure it against a cost and service baseline before scaling.
Traditional Logistics vs. Optimized Logistics
Traditional logistics runs on dispatcher judgment, static rules, and spreadsheets. Optimized logistics runs on data, algorithms, and plans that update as conditions change. The difference shows up in cost per unit, in how far the operation can scale before it breaks, and in how quickly the team recovers when a truck, a dock, or a supplier fails.
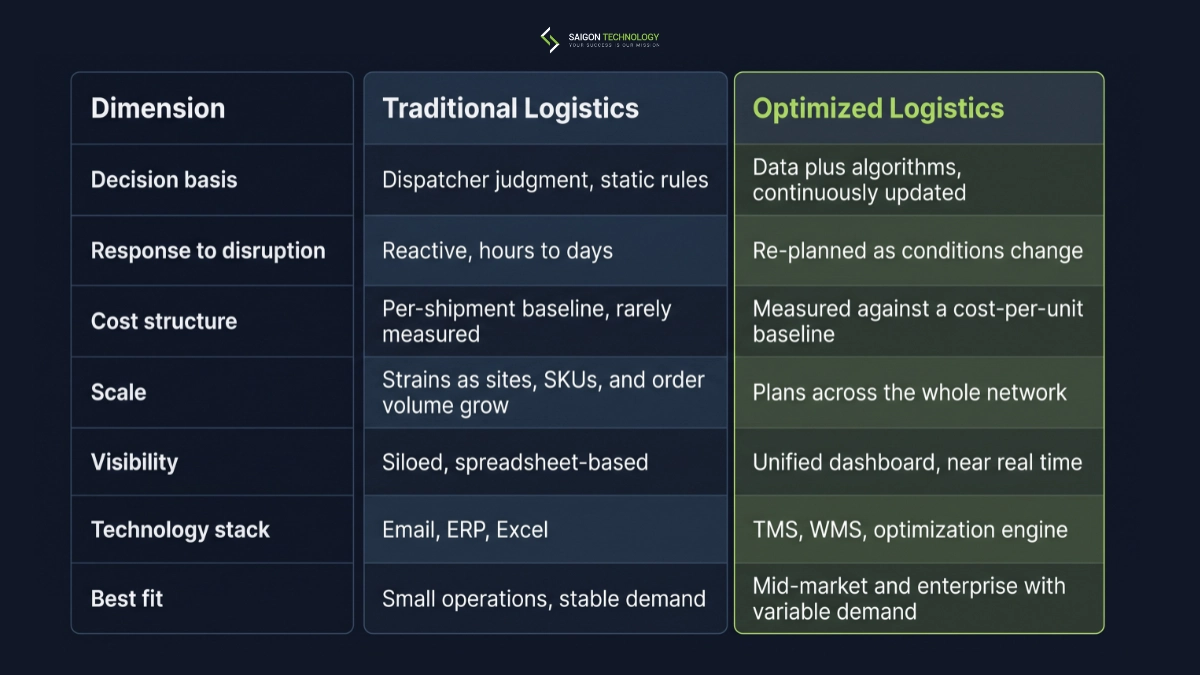
Traditional vs. optimized logistics
| Dimension | Traditional Logistics | Optimized Logistics |
| Decision basis | Dispatcher judgment, static rules | Data plus algorithms, continuously updated |
| Response to disruption | Reactive, hours to days | Re-planned as conditions change |
| Cost structure | Per-shipment baseline, rarely measured | Measured against a cost-per-unit baseline |
| Scale | Strains as sites, SKUs, and order volume grow | Plans across the whole network |
| Visibility | Siloed, spreadsheet-based | Unified dashboard, near real time |
| Technology stack | Email, ERP, Excel | TMS, WMS, optimization engine |
| Best fit | Small operations, stable demand | Mid-market and enterprise with variable demand |
Optimization is only as good as the operational data underneath it, which is why many programs start with the system of record rather than the algorithm. On the Merit Logistics ODC engagement, Saigon Technology’s team first documented a legacy ERP that several vendors had extended over the years, then maintained and rebuilt it with compare testing against the old system, and later added an Android check-in app for field staff.
Five Connected Areas Optimization Covers
Logistics optimization spans five connected areas: network design, transportation, warehouse operations, inventory planning, and load planning. Each can be tuned on its own, but the biggest gains come from coordinating decisions across the network, a view the Association for Supply Chain Management (ASCM) also takes toward optimization in logistics.
Network Design and Logistics Network Optimization
Logistics network optimization decides where distribution centers, cross-docks, and forward-stocking locations sit, and how goods flow between them. Network design models weigh facility cost, inventory holding cost, and transportation expense against each other across different configurations.
Companies often revisit their networks after a merger, a shift in customer demand, or a change in distribution channels. The goal is a structure that balances cost, delivery speed, and service level. In one McKinsey case, a North American tire distributor cut logistics costs by 10–15% by using analytics to redesign and consolidate a network of 150+ warehouses. That is a single company’s result, not a guaranteed outcome (McKinsey, distribution network optimization).
Platforms such as Coupa Supply Chain Design and SAP Integrated Business Planning support this kind of network planning.
Transportation and Route Planning
Route planning sequences delivery stops while accounting for delivery windows, driver hours, vehicle capacity, and transportation cost. Good route optimization helps fleets use capacity more efficiently, cut unnecessary mileage, and keep delivery schedules reliable.
Modern systems factor in live traffic, weather, vehicle telematics, and changing delivery requirements to adjust routes as the day unfolds. The right approach depends on fleet size, delivery density, time constraints, and data quality.
For a deeper look at real-time rerouting and vehicle routing problems, see our guide to how AI handles real-time rerouting and vehicle routing problems.
Warehouse Slotting and Internal Flow
Warehouse optimization focuses on how goods move through a facility: slotting, picking path design, dock scheduling, labor planning, and where products sit in storage. Internal logistics also covers the flow between receiving, storage, picking, packing, and shipping zones.
Good slotting puts frequently picked products where they’re fastest to reach. A 2025 MIT Center for Transportation & Logistics capstone estimated a 24% reduction in order-picking travel distance from optimized slotting at a Newell Brands distribution center. The result is specific to that layout, product mix, and order pattern.
Warehouse management software helps coordinate inventory movement, labor, and fulfillment. See our guide to warehouse management system development.
Inventory Positioning and Demand Forecasting
Inventory optimization decides how much stock to hold and where to place it across the network, balancing carrying cost against availability and service requirements.
Demand forecasting estimates future consumption so inventory levels and safety stock match actual demand rather than historical averages. Depending on the product and demand variability, companies lean on statistical forecasting, machine learning, or distribution requirements planning (DRP).
For networks with several storage and distribution tiers, multi-echelon inventory optimization coordinates stock decisions across locations instead of treating each warehouse in isolation. It accounts for differences in demand, replenishment lead time, and service level at each tier.
Load Planning and Capacity Planning
Load optimization makes the most of available vehicle and trailer capacity while respecting weight limits, dimensions, delivery schedules, and handling requirements. Common techniques include load consolidation, drop-and-hook operations, and planning around stackability constraints.
Palletizing logic determines how boxes stack on pallets and how pallets load into trailers. Coordinating load planning with route planning reduces unused capacity and avoids loading sequences that complicate delivery.
Capacity planning estimates future fleet, warehouse, equipment, and labor needs against forecast demand. Spotting bottlenecks early lets teams adjust before capacity constraints disrupt service.
Seven Techniques That Cut Logistics Cost
These seven techniques are where most cost and service gains come from. Four have published results from named sources; the others are measured with the metrics in the last column, because their payoff depends heavily on the starting point.
Seven cost-cutting techniques
| Technique | What it changes | Documented example or metric to track |
| Network re-engineering | Facility locations and flows between them | McKinsey case: tire distributor, 150+ warehouses, 10–15% lower logistics costs (source) |
| Dynamic routing and scheduling | Routes and stop sequences as conditions change | US EPA SmartWay (2019): Associated Food Stores cut its fleet 38% and annual travel by 400,000 miles after relocating a DC and adopting route planning (source) |
| Multi-echelon inventory optimization | Safety stock across storage tiers | Inventory turnover, fill rate, and stockouts per location |
| Freight consolidation and mode shifting | Load fill and transport mode per lane | US EPA SmartWay (2021): co-loading can reduce transportation costs by up to 30% on certain lanes (source) |
| Warehouse slotting | Product placement by pick frequency | MIT CTL capstone (2025): estimated 24% less picker travel at a Newell Brands DC (source) |
| Carrier management and lane optimization | Carrier mix per lane | On-time delivery, damage rate, and cost per mile by carrier |
| Reverse logistics streamlining | Returns inspection, restocking, repair, disposal | Cost per return, processing time, and recovered value |
Our SAP-integrated SCM portal shows how ERP integration can improve visibility into procurement workflows and purchase orders.
Optimization Models and Approaches
Logistics optimization models fall into four classes, each suited to different problem sizes and decision horizons. Picking the wrong class is a common and expensive mistake: an exact solver on a huge routing problem may never finish, and a heuristic on a facility-location decision may leave money on the table.
Four classes of optimization models
| Model type | Best for | Typical use case | Representative tools |
| Linear Programming (LP) | Linear objectives and constraints with continuous variables | Transportation cost minimization, product blending | Gurobi, CPLEX |
| Mixed-Integer Linear Programming (MILP) | Decisions with continuous and integer or binary variables | Facility location, network design, scheduling | Gurobi, CPLEX, Google OR-Tools |
| Heuristics and metaheuristics | Large or complex problems where good solutions are needed quickly | Vehicle routing, dynamic rescheduling | Google OR-Tools Routing, custom algorithms |
| Simulation modeling | Testing system behavior under different assumptions and uncertainty | Network changes, capacity stress tests, warehouse scenarios | AnyLogic, SimPy, FlexSim |
Mathematical programming underpins the first three. Simulation complements them when the question is “what might happen” rather than “what is best.” Commercial solvers such as Gurobi dominate the exact-solution end, and open-source tools like Google OR-Tools cover most heuristic needs.
Machine learning fits into these models rather than replacing them. ML predicts travel times or demand, and the optimization model still produces the plan from those predictions.
Logistics Optimization Software: Categories and Selection
Several categories of software support optimization, and each one owns a different decision. The right choice depends on which decision you need to improve, the systems you already run, and how much of your logic is standard.
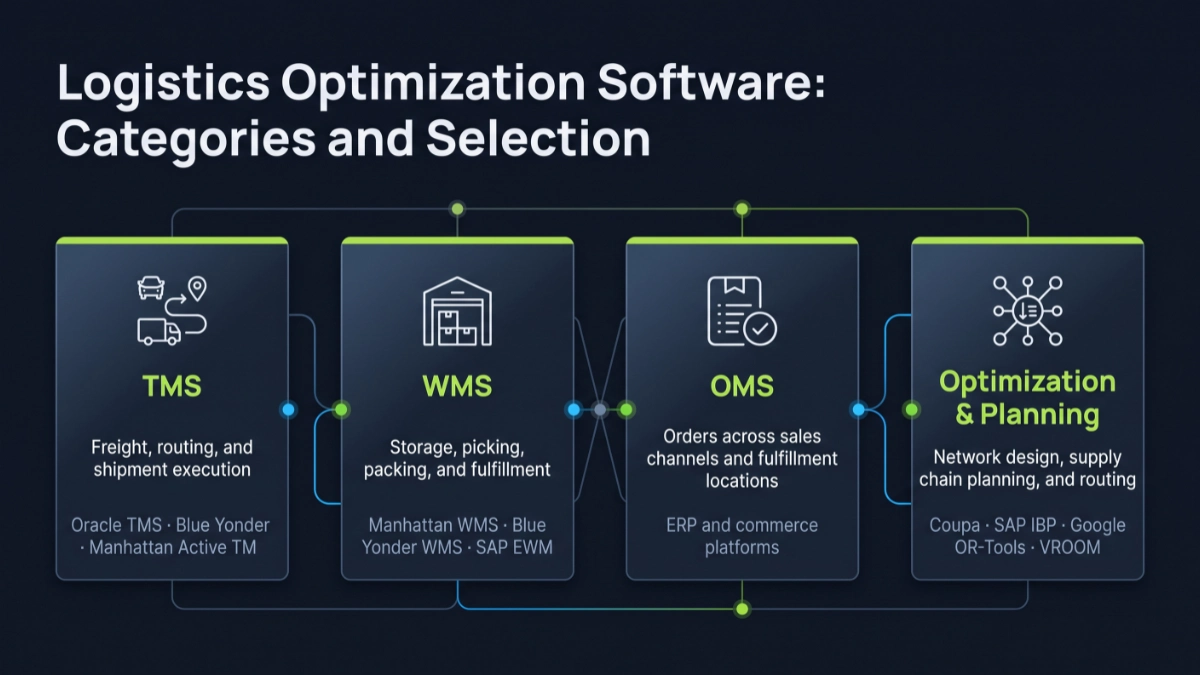
Software categories
| Category | What it manages | Examples |
| Transportation Management System (TMS) | Freight, routing, and shipment execution | Oracle TMS, Blue Yonder, Manhattan Active TM |
| Warehouse Management System (WMS) | Storage, picking, packing, and fulfillment | Manhattan WMS, Blue Yonder WMS, SAP EWM |
| Order Management System (OMS) | Orders across sales channels and fulfillment locations | Usually part of an ERP or commerce platform |
| Optimization and planning tools | Network design, supply chain planning, routing | Coupa, SAP IBP, Google OR-Tools, VROOM |
Seven criteria to evaluate:
- Integration with existing systems
- Scalability for projected business growth
- Data visibility and dashboard quality
- Machine learning for forecasting and optimization
- Time-to-value
- Total cost of ownership
- API support and customization
Build-versus-buy decisions depend on integration needs, operational complexity, and customization requirements. Off-the-shelf platforms suit standard workflows. Proprietary integrations and specialized routing logic usually call for custom software development services, which is the work Saigon Technology’s engineering teams typically handle.
Linh Pham, Senior Solution Architect at Saigon Technology, explains where that decision is usually made: “When a client is deciding whether to buy or build, we map their ERP, WMS, and carrier connections before comparing solvers. Commercial engines handle routing and load planning well. The real cost is keeping each plan in sync with the systems they already run.”
AI and Machine Learning in Logistics Planning
AI and machine learning support logistics optimization by improving forecasts, inventory decisions, network planning, and warehouse operations. Their value depends on data quality and on how well they fit existing workflows, so the starting question is which decision the model will change and who will act on its output.
AI and machine learning applications
| Application | What it does |
| Demand forecasting | Machine learning analyzes sales, promotions, weather, and other demand signals to improve forecasts and support inventory planning |
| Inventory optimization | Predictive models and optimization algorithms balance stock levels, holding costs, and service levels; reinforcement learning is an option for complex, dynamic inventory decisions |
| Network scenario modeling | AI-assisted planning tools help teams evaluate changes to distribution networks, costs, and service levels |
| Warehouse automation | Computer vision supports picking, product identification, and outbound quality inspection |
For routing, AI can adjust delivery plans as traffic, weather, and operational conditions change. See our guide to AI-driven routing algorithms and implementation patterns for technical approaches and build-versus-buy considerations.
AI is not always the best tool. Poor data quality, limited integration, and operational complexity can reduce its value, and some logistics problems are better solved with established operations research methods. Saigon Technology’s AI development services help businesses build AI solutions around practical operational needs.
How to Reduce Logistics Costs
Cutting logistics cost starts by finding your biggest cost drains and fixing the ones with the clearest payoff. Most logistics budgets lose money in four places: freight, network structure, warehouse labor, and returns. The table below shows what named companies reported after tackling each one.
Reported results by cost lever
| Cost lever | Reported result | Key focus |
| Freight consolidation | Up to 30% lower transportation costs on certain lanes (US EPA SmartWay, 2021) | Co-loading compatible shipments |
| Network redesign | 10–15% lower logistics costs (McKinsey case, one tire distributor) | Distribution center locations and flows |
| Warehouse slotting | Estimated 24% less order-picking travel distance (MIT CTL capstone, 2025) | Product placement and picking patterns |
| Reverse logistics | 30% lower cost per return (ReturnPro case study, vendor data) | Return handling and product disposition |
Sources: US EPA SmartWay co-loading, McKinsey distribution network optimization, MIT warehouse slotting capstone, and ReturnPro case study.
These numbers come from specific companies and are not guarantees. Your savings depend on your starting point. To find out where you stand, track freight cost, warehouse cost per unit, inventory carrying cost, and return cost against KPIs like OTIF and customer satisfaction. Then weigh the expected savings against the cost of the change, and keep checking the progress of each logistics optimization initiative with a performance evaluation system instead of a one-time review.
Reverse Logistics: Returns, Repairs, and Recovery
Reverse logistics covers everything that comes back: returns, damaged goods, repairs, and products at the end of their life. It’s a harder problem than shipping out, because return volume is unpredictable and every item can arrive in a different condition.
Three things help:
- Decide what happens to a returned item right away. Don’t let it sit in storage while someone figures it out. Quick decisions also cut down on damage to inventory.
- Sort items by condition, not by default process. Inspect, repair, resell, or recycle, whichever fits, instead of running everything through the same steps.
- Look at the data behind your returns. It shows which products fail often, where processing slows down, and where recoverable value is being lost, and it gives the team specific fixes for the next quarter.
Track four numbers: cost per return, processing time, recovered value, and the share of returns that go back into sellable stock. One ReturnPro case study reports that a home improvement retailer cut its cost per return by 30% after categorizing returns at store level and redesigning its reverse warehouse workflows.
Optimization Priorities by Industry
What matters most in logistics optimization changes by industry. Delivery speed, product type, and customer promises all shift the priorities, so the same technique can be the first fix in one sector and an afterthought in another.
Ecommerce and Last-Mile Delivery Optimization
Ecommerce companies are always trading off speed against cost. Grouping deliveries, planning smarter routes, and placing fulfillment centers closer to customers all help. Because delivery windows are tight and lead times are hard to predict, prescriptive analytics earns its keep here: instead of only flagging a problem, it suggests what to do about it. Watch cost per delivery, first-attempt delivery success, vehicle utilization, and on-time rate.
3PL Operations
Third-party logistics providers juggle different service promises for each client while sharing the same warehouse space and carriers. Scorecards work in both directions here: they track the reliability of the 3PL’s own carriers and suppliers, and they give each client visibility into how its shipments are performing. Keeping each client’s data separate and access-controlled matters as much as the operations themselves.
Healthcare Logistics
Healthcare logistics has to get the product there intact, on time, and traceable, while meeting regulatory requirements most other industries don’t face. Medicines and biologics often need temperature monitoring and documented cold-chain handling the whole way. Cost matters, but never at the expense of product safety.
Inbound and Supply-Side Logistics
Inbound logistics handles everything coming in from suppliers before it reaches your warehouse. Get this wrong and you end up with trucks backed up at the dock, too much inventory sitting around, and production delays that ripple downstream.
Supplier scorecards, better dock scheduling, shipment consolidation, and closer coordination between procurement, warehousing, and transportation teams all help. In practice, this usually means cross-functional teams working from the same data instead of three separate spreadsheets. Track supplier on-time delivery, inbound transportation cost, receiving speed, and whether materials are available when production needs them.
Implementation Roadmap: 5 Steps to Optimize Your Logistics
A five-step sequence keeps a logistics optimization program tied to measured results instead of a one-off software purchase. Each step has a clear output that the next step depends on, so skipping one usually means redoing it later at a higher cost.
- Assess current state. Audit data sources, set baseline costs per unit and per lane, and benchmark against industry KPIs. Involve operations, finance, IT, and procurement from day one.
- Define optimization scope. Decide whether the program targets strategic redesign (network, facilities) or tactical tuning (routes, labor, inventory). Different scopes need different models, teams, and timelines.
- Select the approach. Buy a platform, build custom, or combine the two. The decision usually depends on integration depth and competitive differentiation, not algorithm quality.
- Pilot on a bounded operation. Pick one region, one product line, or one lane. Prove the model, calibrate it against operating data, and set up the performance evaluation system before scaling.
- Scale with change management. Roll out across the operation with workshops, training, and continuous improvement loops. Performance monitoring and quarterly reviews keep the program improving rather than decaying.
On a fleet management platform we built for a B2B operator, the work centred on giving three different user types one system for scheduling, driver and vehicle assignment, and geofenced route management, which is the kind of operational base a pilot needs before optimization can scale.
For organizations that want advisory support rather than a hands-on build, consulting typically runs alongside the first two steps. Contingency planning for natural disasters, labor disruption, and supplier failure is best built into the operating model during step 2, not bolted on after step 5.
Frequently Asked Questions
Which KPIs show whether optimization is working?
Common KPIs include transportation cost per shipment, cost per order, on-time delivery rate, vehicle utilization, inventory turnover, order fulfillment time, and warehouse picking productivity. Choose the metrics that match your optimization goals and compare them against a consistent baseline taken before the change.
Should we buy logistics optimization software or build custom?
The right choice depends on how standard your workflows are and how much control you need over the logic. Buy when your processes fit standard vendor assumptions and your integration surface is standard. Build custom when you need deep integration with a proprietary ERP or WMS, your constraints are industry-specific (hazmat, cold chain, regulatory), or your routing or inventory logic is a competitive advantage you want to own. Many companies land on a hybrid: a licensed platform for the standard workflows, with custom extensions for the proprietary logic.
What drives the cost of custom optimization software?
Cost depends mainly on the number and depth of integrations (ERP, WMS, TMS, telematics, carrier APIs), the complexity of your routing or inventory constraints, real-time requirements, data cleanup, and how many sites and regions the system must cover. A single-lane pilot costs far less than a multi-region platform. For a detailed breakdown, see our cost guide for custom logistics software. Saigon Technology’s published rate for senior-led development is $22–$46 per hour, and the final budget depends on scope, team composition, and timeline.
What are the 7 C’s of logistics?
There is no single standard list. Different publishers use the term for different frameworks. One version, published by freight forwarder Emotrans in 2025, lists Connect, Create, Customize, Collaborate, Consolidate, Control, and Coordinate. Others use it for “right product, right customer, right cost” style checklists, which overlap with the better-known 7 R’s of logistics. If a partner or course uses the term, ask which version they mean.
What are the 5 P’s of logistics?
Like the 7 C’s, the 5 P’s has no standard definition. Some logistics vendors adapt the marketing mix (product, place, price, promotion, and packaging) to describe what shapes how goods are moved and delivered. Others use it as an internal checklist for operations. Treat it as a discussion aid rather than a formal model.
Plan Your Optimization Program With Saigon Technology
Optimization pays back when the right analytical levers hit the right cost drivers, in software that fits the systems you already run. That usually means starting with one well-measured pilot and growing from there.
Saigon Technology has 14+ years in software delivery, with logistics work that includes a fleet management platform, an SAP-integrated SCM portal, and an ERP modernization delivered through an ODC. Our 400+ engineers work under ISO 9001 and ISO 27001 certifications as a Microsoft Solutions Partner, with NDAs and role-based access as standard. We have delivered 850+ projects for 300+ clients across the US, Australia, Singapore, and Europe, and teams who hire developers through us can start with a two-week risk-free trial.
Planning a logistics optimization program? Send us your requirements and our team will come back with architecture direction and a build-vs-buy recommendation. Turnaround starts at 48 hours, depending on scope.


Related articles
Logistics Software Development Cost: $30K–$500K Guide
 Thien (Tim) Nguyen
  28 May 2026
Fleet Management Software Development: Complete Guide (2026)
28 May 2026 
Transportation Management System (TMS): The 2026 Guide
08 Jul 2026 
IoT in Transportation and Logistics: 12 Use Cases, Benefits & ROI Guide (2026)
30 Jul 2026 
AI Route Optimization: How It Works, Benefits, and Use Cases 2026
14 Oct 2026