Build Deep Learning model for the Image Classification task (Part2): Structure, Monitoring for training
: Structure, Monitoring for training")
Welcome back to Part 2 of my tutorial on building a deep learning model for image classification. In Part 1, It covered the basics of deep learning and walked through the steps to prepare our data for training and basic deep learning model or environment as well. Now, we will focus on the structure of the deep learning project and how to monitor it during training. In the previous blog, you could see I follow an “all-in-one” style for combining all code into one file. In this blog I will introduce you to the basic deep learning project structure and some monitors to help you to track the model performance during training.
1. Project structure
When starting a new deep learning project, it’s essential to plan ahead and think about the overall structure of the project. This will make it easier to maintain your code and data as your project grows, and to collaborate with other developers and researchers.
1.1. Key components
Here are the key components of a deep learning project:
- Data: The first step in any machine learning project is to gather and preprocess data. In the case of image classification, this means collecting a large dataset of images that are labeled with the corresponding classes. There are several popular datasets for image classification, such as CIFAR-10, MNIST, and ImageNet. You can also create your dataset by collecting images from various sources.
Once you have your dataset, you will need to preprocess it by resizing the images, normalizing the pixel values, and splitting it into training, validation, and testing sets. It’s essential to ensure that your data is well-organized and that the directory structure is consistent across all subsets.
- Model: The next component of a deep learning project is the model itself. There are many deep learning architectures to choose from, such as Convolutional Neural Networks (CNNs), Residual Networks (ResNets), and Recurrent Neural Networks (RNNs). You can also use transfer learning by fine-tuning pre-trained models such as VGG16 or Inception.
It’s crucial to define the model architecture clearly and to document any hyperparameters and design decisions. This will make it easier to reproduce your results and to make changes to the model in the future.
- Training: Once you have your data and model, it’s time to train the model on the training set. This involves running the images through the model and adjusting the weights and biases to minimize the loss function. You can use various optimization algorithms, such as stochastic gradient descent (SGD), Adam, or RMSprop.
It’s important to monitor the training process by logging the loss and accuracy metrics, and to use techniques such as early stopping and learning rate scheduling to prevent overfitting and speed up convergence.
- Evaluation: After training, you need to evaluate the performance of the model on the validation set. This involves running the images through the model and computing metrics such as accuracy, precision, recall, and F1 score. You can also use techniques such as confusion matrices and ROC curves to analyze the model’s behavior.
It’s important to report the evaluation results clearly and to compare them with the state-of-the-art models in the literature. This will help you determine whether your model is good enough for the intended application.
- Deployment: Finally, once you have a trained and evaluated model, it’s time to deploy it in the real world. This involves converting the model into a format that can be run on different platforms, such as TensorFlow Lite or ONNX. You can also deploy the model on the cloud or on edge devices such as Raspberry Pi or Jetson Nano.
It’s important to document the deployment process clearly and to test the model thoroughly on new data to ensure that it behaves as expected.
Now that we have covered the key components of a deep learning project, let’s discuss how to organize your code and data to ensure efficiency and reproducibility.
1.2. Code structure
1.2.1. Data Organization
In this structure, we have separate directories for the training, validation, and testing data, with subdirectories for each class. This makes it easy to load the data using data generators or PyTorch datasets.
|
“` project/ data/ train/ class1/ image1.jpg image2.jpg … class2/ image1.jpg image2.jpg … classN/ image1.jpg image2.jpg … val/ class1/ image1.jpg image2.jpg … class2/ image1.jpg image2.jpg … classN/ image1.jpg image2.jpg … test/ class1/ image1.jpg image2.jpg … class2/ image1.jpg image2.jpg … classN/ image1.jpg image2.jpg … “` |
Fig1: Dataset structure
It’s essential to organize the data in a consistent and reproducible manner. Here are some tips for organizing the data:
– Use a consistent directory structure across all subsets
– Name the images using a clear and descriptive convention, such as `{class}-{index}.jpg`
– Use a separate CSV file or JSON file to store the class labels and image paths
– Use data augmentation techniques such as flipping and rotation to increase the size of the dataset
– Normalize the pixel values using a standard technique, such as dividing by 255 or subtracting the mean and dividing by the standard deviation
1.2.2. Code Organization
For the code organization, you could apply the basic structure like below:
|
project/ data/ train/ … val/ … test/ … config/ config.yml src/ model/ __init__.py cnn1_model.py cnn2_model.py vgg16_model.py layers.py config.py dataset.py loss.py optim.py util.py train.py eval.py predict.py log/ mlruns/ model/ requirements.txt README.md |
Fig2: Project structure
The `data/` directory contains the dataset for our project, you could follow the previous section to understand how to organize data for the Image classification task, and I will not mention it again.
The `src/` directory will contain all of our modules for building models like model architecture, loss modules, optimizer modules, or some support modules like utilities, config reader… It’s important to modularize the code and to use clear naming conventions to make it easy to understand and modify.
- The `src/model/` directory contains the the code for the model architecture, including any custom layers, e.g: `vgg16_model.py`, `cnn_model.py` or `layers.py`
- The `src/model/config.py` file contains the the code for configuration object class, it will load the configuration for your model from the yaml file in `config/config.yml` file, and then parsing the dict data into the Python Class object for you to use in the model.
- The `src/model/dataset.py` file contains the code for the dataset reader object, for example we will define the Pytorch dataset loader in this module to use during the training process.
- The `src/model/loss.py` file contains the code for the loss function of our models, we could define some custom loss function here.
- The `src/model/optim.py` file contains the code for the optimizer module for the training process.
The `train.py`, `eval.py`, and `predict.py` scripts are responsible for training, evaluating, and deploying the model, respectively. These scripts should use the modules in the `src/` directory and should take command-line arguments for flexibility.
Some other folders, like `log/` will be used to store the training result using tensorboard tool, `mlrun/` will be the same but for using mlflow tool, `model/` will be used to store the trained model after finishing.
Finally, the `requirements.txt` file contains a list of dependencies required to run the code, and the `README.md` file provides documentation and instructions for running the project.
For more detail, you could check the full demo source code here for the project structure: https://github.com/phonglesaigontechnology/Image-Classification-Model-2
2. Monitoring
When training a deep learning model for image classification, it’s essential to monitor its performance closely to ensure that it’s learning effectively and not overfitting to the training data. Overfitting occurs when the model performs well on the training data but poorly on the test data, which indicates that it has memorized the training data instead of learning the underlying patterns.
2.1. Monitor Values
There are several ways to monitor the performance of your deep learning model during training.
- Loss and accuracy: The loss function is a measure of how well the model is able to predict the correct output for a given input. During training, the goal is to minimize the loss function, which means that the model is improving its ability to make accurate predictions. The accuracy metric measures the percentage of correctly classified images during training. It’s a useful metric for evaluating the performance of the model on the training data, but it doesn’t necessarily indicate how well the model will perform on new, unseen data.
It’s important to monitor the loss and accuracy metrics during training and to plot them over time using a visualization tool such as TensorBoard. This will allow you to see how the model is improving over time and to identify any potential issues, such as overfitting or underfitting.
- Learning rate: The learning rate is a hyperparameter that controls the step size taken during gradient descent optimization. It determines how quickly the model updates its weights during training.
Monitoring the learning rate during training can help you to optimize it for better performance. If the learning rate is too high, the model may overshoot the optimal weights and converge to a suboptimal solution. If the learning rate is too low, the model may take too long to converge or get stuck in a local minimum.
- Early stopping: Early stopping is a technique used to prevent overfitting during training. It involves monitoring the performance of the model on a validation set and stopping the training process when the performance on the validation set stops improving.
To implement early stopping, you can use a callback function in your training script that monitors the performance on the validation set and stops the training process when the performance stops improving for a certain number of epochs.
- Regularization techniques: Regularization techniques are used to prevent overfitting by adding additional constraints to the model during training. There are several types of regularization techniques, including L1 and L2 regularization, dropout, and data augmentation.
Monitoring the impact of these techniques on the training performance can help you to optimize them for better performance. For example, you can experiment with different dropout rates or regularization strengths to see how they affect the model’s performance.
In conclusion, monitoring the performance of your deep learning model during training is essential for ensuring that it’s learning effectively and not overfitting to the training data. By monitoring metrics such as loss, accuracy, learning rate, and regularization strength, you can optimize your model for better performance and prevent overfitting.
2.2. Tools:
There are several other monitoring tools available for deep learning models. Here are a few examples: MLflow, Tensorboard, Neptune.ai, Weights & Biases, Comet.ml…
But I will only introduce you to MLflow and Tensorboard because they are not cloud-based tools. They are open-source platforms, free to use, and can be run locally or on a cluster, and it integrates with many popular machine learning libraries such as TensorFlow, PyTorch, and scikit-learn
- MLflow provides tools for managing experiments, packaging code into reproducible runs, and sharing and deploying models. MLflow allows you to track model training runs, experiment results, and model artifacts. You can use it to compare model performance across different experiments and to reproduce and share your results.
|
import mlflow # Setup MLflow mlflow.set_tracking_uri(“./mlruns”) mlflow.set_experiment(“MyModel CNN”) # Log params for key, value in config.__dict__.items(): mlflow.log_param(key, value) # Log training loss mlflow.log_metric(‘train_loss’, loss.item(), step=global_step) # Log training accuracy mlflow.log_metric(‘val_accuracy’, accuracy, step=epoch) |
To view the logs in MLFlow, run the command below in the terminal at the `project/` folder and navigate to http://localhost:5000 in your browser.
|
(venv)$ mlflow ui |
Fig3: MLFlow Dashboard UI
- TensorBoard is a visualization toolkit that comes with TensorFlow. It allows you to visualize your TensorFlow model graph, training curves, and other metrics during training. TensorBoard can also help you debug your model and analyze its performance. It supports features such as profiling, graph visualization, and embedding visualizations.
|
from tensorboardX import SummaryWriter # Setup TensorBoard writer = SummaryWriter( ‘log/tensorboard_cnn’, time.strftime(“%Y-%m-%d-%H-%M-%S”))) # Log training loss writer.add_scalar(‘train/loss’, loss.item(), global_step) # Log training accuracy writer.add_scalar(‘val/accuracy’, accuracy, epoch) |
To view the logs in TensorBoard, run the command below in the terminal at `project/` folder and navigate to http://localhost:6006 in your browser.
(venv)$ tensorboard –logdir=./logs/tensorboard_cnn
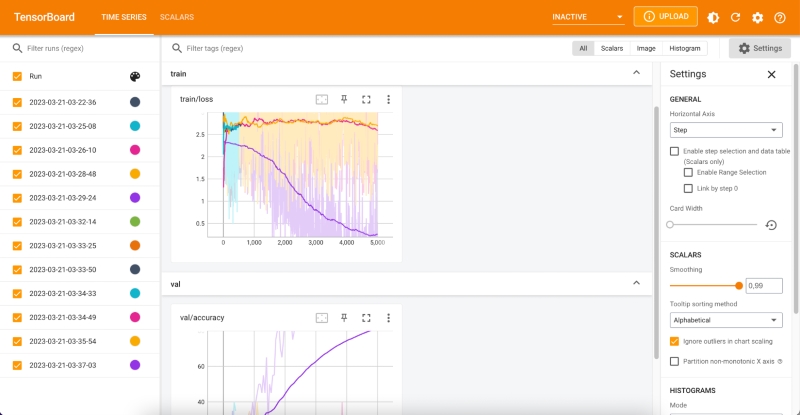
Fig4: Tensorboard Dashboard UI
In this code, we use the `SummaryWriter` from TensorBoardX and the `mlflow` library to log the training loss and test accuracy to both TensorBoard and MLflow.
Resources
- Demo source code: https://github.com/phonglesaigontechnology/Image-Classification-Model-2
References
- No

AI Development Services
Related articles

The Difference Between AI Software And Traditional Software Business

The Differences Between AI and ML

The Innovation of Computer Vision with AI and ML

Key Types of AI to Consider for a Successful Business